Research & Academic Projects
UK Parliamentary Speech Analysis Pipeline

Built an end-to-end NLP pipeline to analyze 670,000+ parliamentary speeches from the ParlaMint Commons corpus (2015–2022). Applied BERT-based transformer models and LLM-assisted thematic coding to classify rhetorical strategies—including Framing, Compensation, Hiding, and Blaming—with inductive sub-strategy discovery. Developed a multi-stage workflow encompassing XML extraction, semantic similarity filtering using sentence-transformer embeddings, and classification pipelines for policy-related speech data. This work contributed to a publication: Robertson et al. (2025).
Tools & Technologies: Python, BERT, Hugging Face Transformers, Sentence-Transformers, NLP, XML Parsing, ETL
Publication: Robertson et al. (2025) . GitHub: View Repo
Data Centers & Climate-Related Concerns in the USA
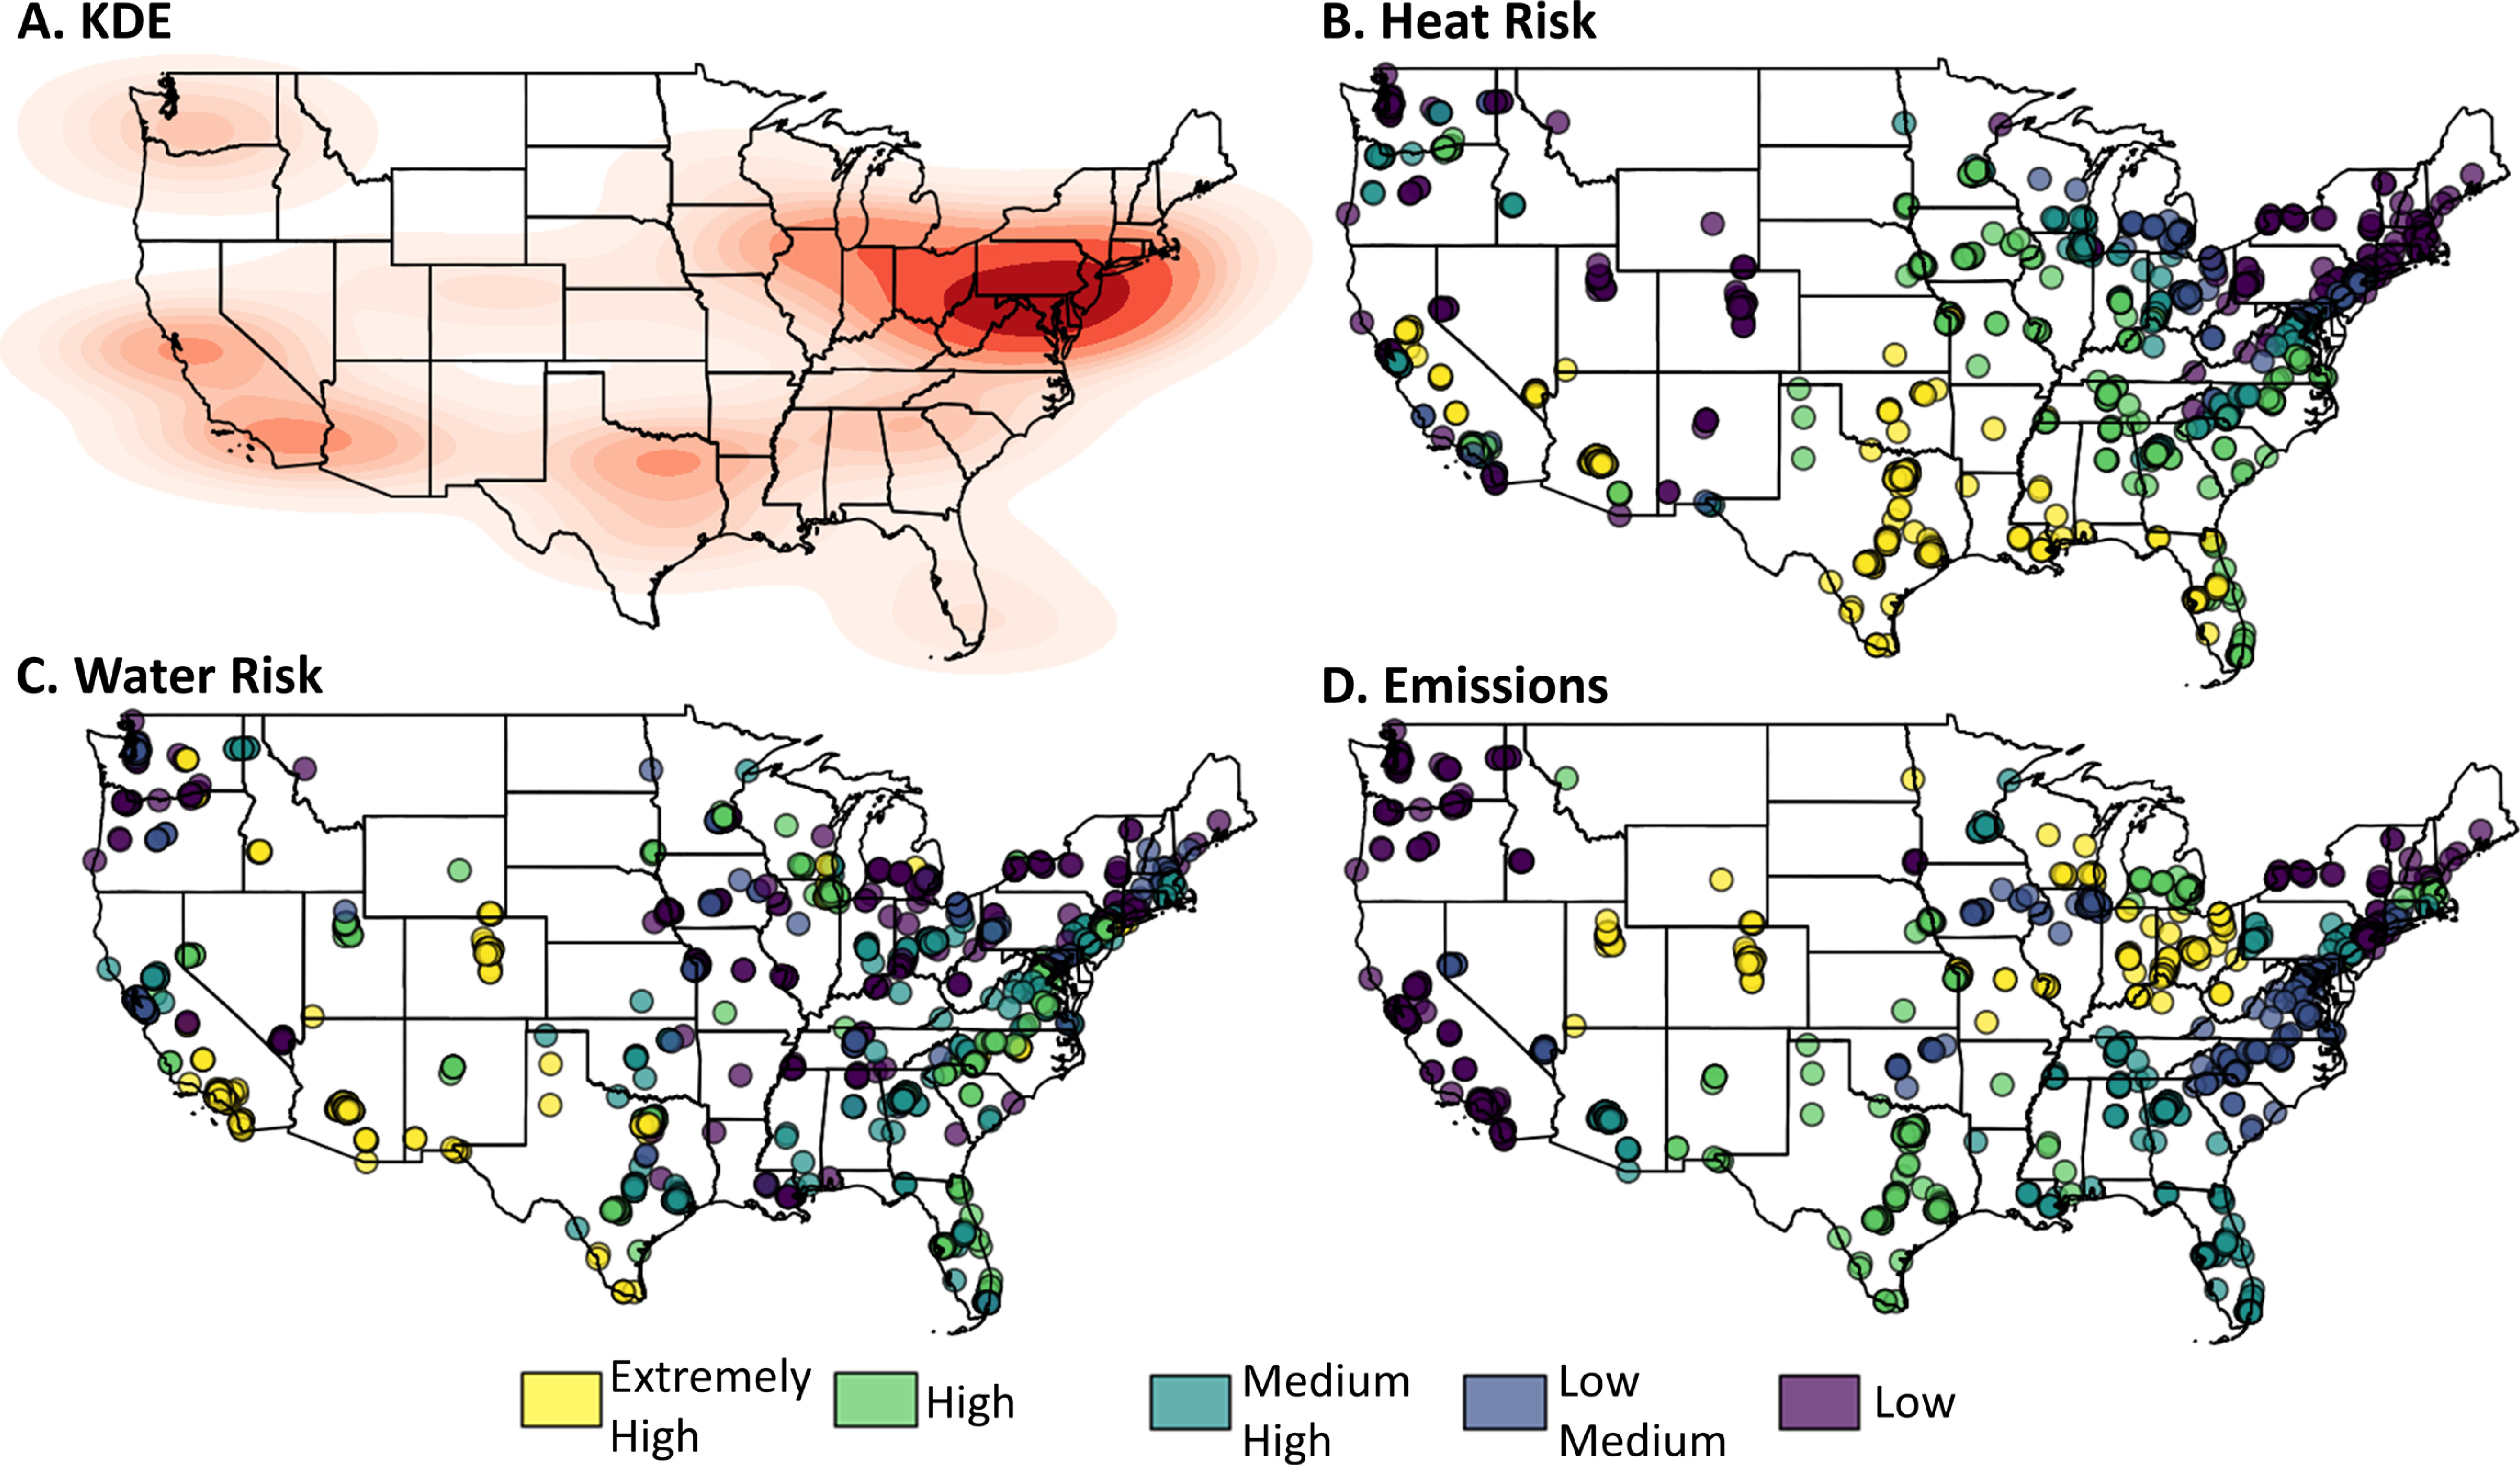
Investigated the environmental and community-level impacts of data center proliferation across the United States, analyzing climate-related concerns tied to energy consumption, water usage, and land use. Published a dataset with an accompanying Python package to support reproducibility and further research in the space.
Tools & Technologies: Python, Data Analysis, Geospatial Analysis
Published Dataset & Package: doi:10.5281/zenodo.17372375
GitHub: View Repo
Vision Zero – NYC Traffic Safety Causal Inference

Conducted a rigorous causal inference study evaluating the impact of Vision Zero traffic-calming interventions on crash outcomes in New York City. Applied Difference-in-Differences (DiD) methodology on 2M+ crash records, integrating multi-year NYC crash datasets with American Community Survey (ACS) and Bureau of Economic Statistics (BES) panel data. Quantified the effectiveness of infrastructure changes—such as speed humps, pedestrian islands, and signal retiming—on reducing injuries and fatalities at the borough level.
Tools & Technologies: R, Causal Inference, Difference-in-Differences, Panel Data, ACS/BES Integration
Presentation: AGU 2024 Poster
Multimodal Misinformation Detection System
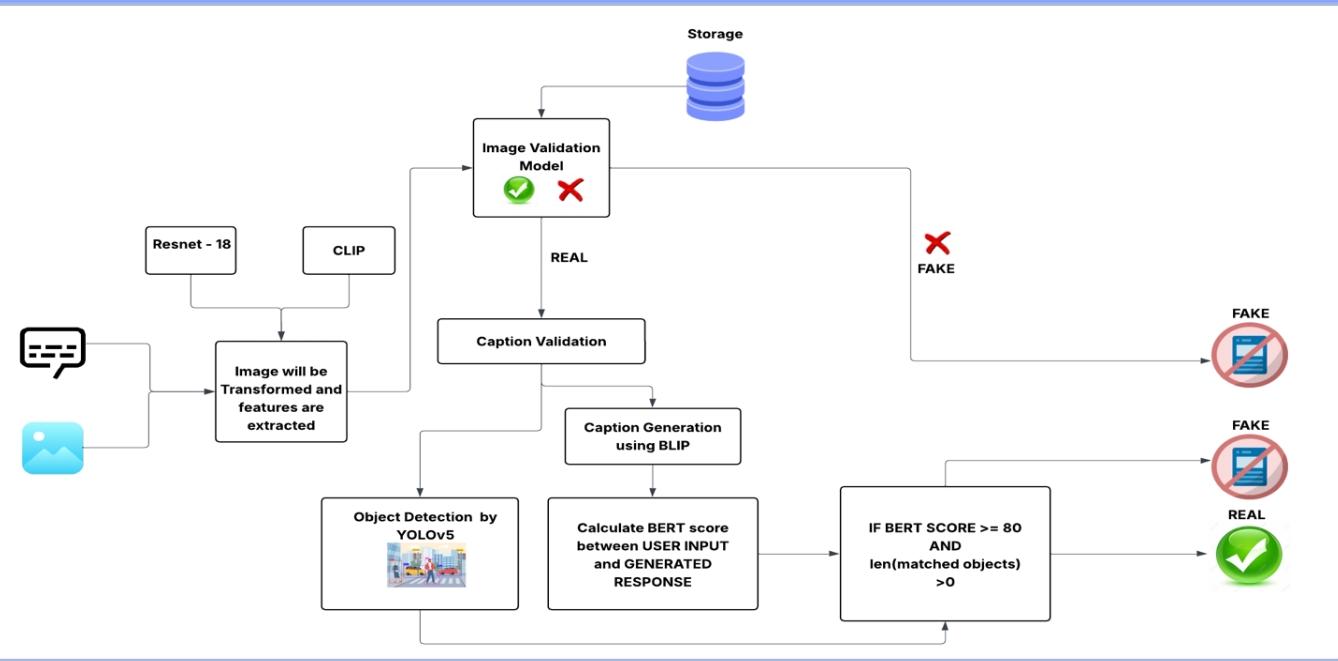
Developed a multimodal detection system combining vision and language models to identify misinformation across text and image content. Integrated ResNet-18 for image feature extraction, CLIP and BLIP for cross-modal alignment, and BERT for textual analysis. Achieved 95% detection accuracy through ensemble fusion of modality-specific predictions. Designed the pipeline to handle real-world content where manipulated images are paired with misleading text.
Tools & Technologies: PyTorch, ResNet-18, CLIP, BLIP, BERT, Multimodal Learning, Deep Learning
GitHub: View Repo
Scene-Speak – AI Cinematic Storytelling (Hoya Hacks 2026)
Built an AI-powered cinematic storytelling application at Hoya Hacks 2026 that converts images or descriptive text into immersive audio scenes with character conversations and ambient sound. Orchestrated multiple LLMs to handle scene interpretation, dialogue generation, and audio synthesis in a coordinated pipeline. Designed to transform static visual or textual input into rich, layered audio narratives.
Tools & Technologies: Python, LLM Orchestration, Audio Synthesis, Prompt Engineering
GitHub: View Repo
My Own Medic – AI Health Chatbot (George Hacks 2025)
Developed an AI-powered health chatbot at George Hacks 2025 that provides preliminary health information and guidance based on user-reported symptoms. Built with a focus on accessibility and conversational UX, enabling users to describe their conditions in natural language and receive relevant health insights.
Tools & Technologies: Python, NLP, Chatbot Development, Prompt Engineering
GitHub: View Repo
Reducing Nitrogen Loss in the Chesapeake Bay

Developed a comprehensive nitrogen supply chain model in collaboration with the U.S. Department of Agriculture (USDA), integrating 7+ datasets spanning crop production, livestock operations, and interstate trade flows. The model supports market-based strategies for reducing nitrogen loss across the Chesapeake Bay region. Built interactive visualizations using Python Dash to communicate findings to stakeholders and advance USDA’s 2030 and 2050 nitrogen reduction goals.
Tools & Technologies: Python, Data Modeling, Dash, PyCharm, ETL
GitHub: View Repo
Interactive Dashboard – Nitrogen Loss in Food Industry
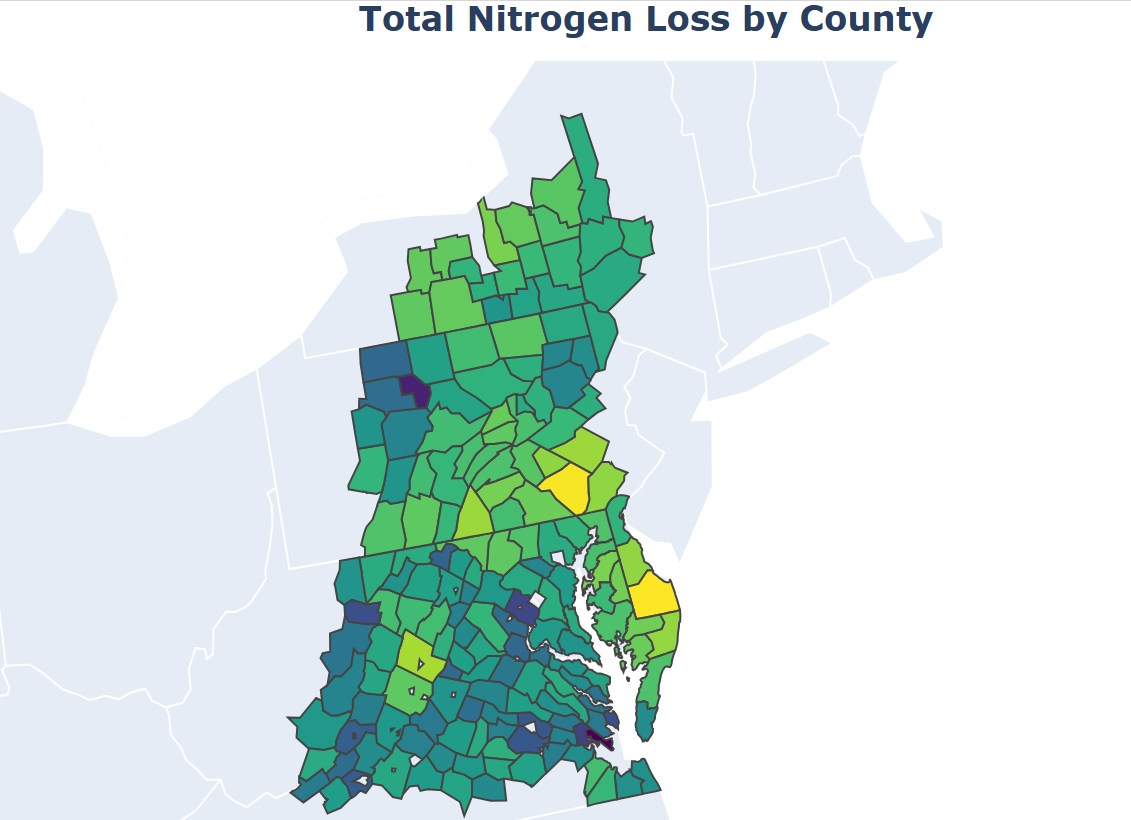
Designed and deployed a public-facing interactive dashboard to visualize county-level nitrogen loss within the Chesapeake Bay watershed. Leveraged Python Dash and choropleth maps to enable geographic exploration of nitrogen trends and agricultural emissions. Built as a companion tool to the USDA nitrogen reduction model and deployed on a custom domain for open access by researchers and policy analysts.
Tools & Technologies: Python Dash, Choropleth Maps, Web Deployment
GitHub: View Repo
Energy Data Collection for Renewable Plants

Processed and structured over 66,000 climate data files—wind, solar radiation, and temperature—sourced from the National Renewable Energy Laboratory (NREL), covering 11,000+ energy plant locations across the United States. Developed a climate data repository to support renewable energy forecasting and infrastructure planning. Applied K-means clustering to identify regional climate trends and automated the data pipeline using API integrations and custom ETL workflows.
Tools & Technologies: R, APIs, K-means Clustering, ETL, Web Scraping
GitHub: View Repo
EV Supply Chain Modeling
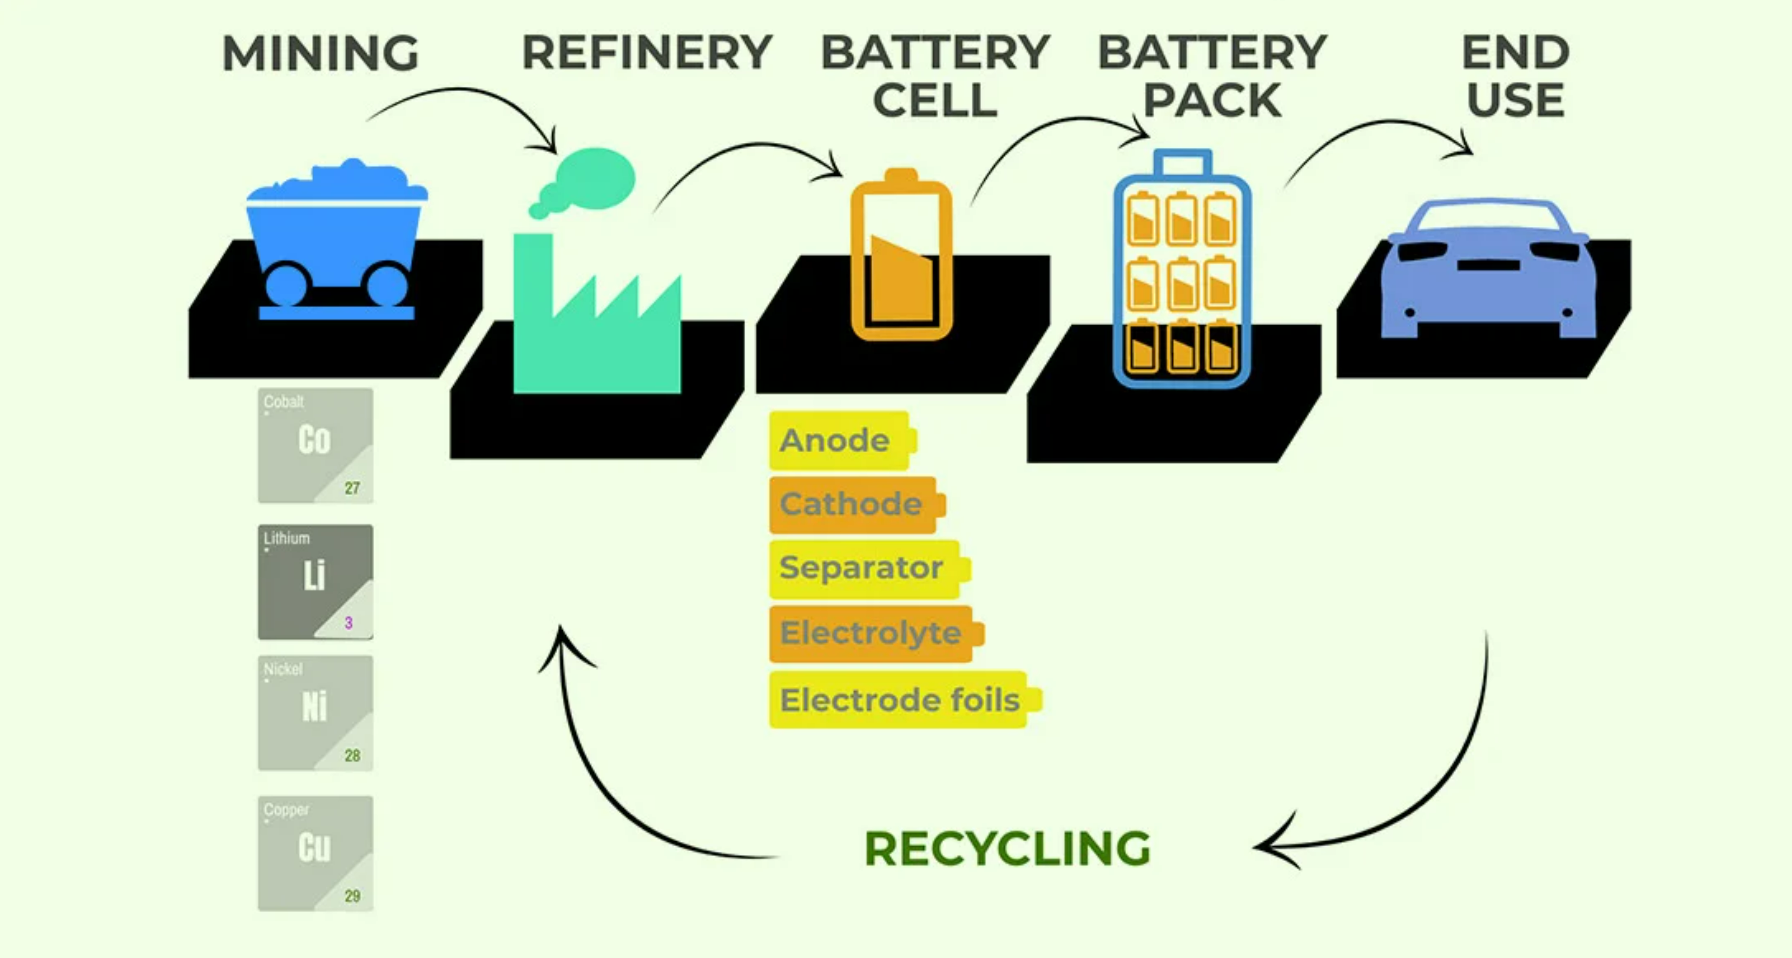
Built a simulation model to assess the life cycle environmental impact of electric vehicle (EV) production under various manufacturing and sourcing scenarios. Evaluated the benefits of onshoring EV component manufacturing to the U.S., incorporating emissions data from global supply chains and accounting for regional grid carbon intensity. Used scenario analysis to explore trade-offs in energy use, resource efficiency, and carbon emissions across future policy pathways.
Tools & Technologies: Python, Data Modeling, Pandas, Scenario Analysis, Matplotlib
Survey Modeling & Deployment – Charleston Area

Designed and deployed an R Shiny app for real-time demographic data collection in the Charleston area. Integrated with Qualtrics for survey management and hosted on shinyapps.io to support regional social research initiatives.
Tools & Technologies: R Shiny, Qualtrics, Supabase, shinyapps.io, Data Visualization
GitHub: View Repo
FEWsLab Lab Website – fewslab.org
Designed and developed a fully functional academic website for FEWsLab using Quarto. The site includes a team directory, project showcase, and interactive content reflecting the lab’s interdisciplinary research across food, energy, and water systems.
Tools & Technologies: Quarto, Markdown, YAML, GitHub Pages
Website: fewslab.org
GitHub: View Repo
Vehicle Crash Analysis – NYC (2012–2024)

Explored long-term traffic crash trends and borough-wise injury distributions across New York City from 2012 to 2024. Built dashboards and analytical visualizations in R and Quarto to support safety policy evaluation and communicate findings to a broader audience.
Tools & Technologies: R, ETL, Quarto, Data Visualization
Report: View Report
NYISO Electricity Forecasting

Analyzed 20+ years of NYISO electricity consumption and pricing data to build predictive models for the New York energy market. Forecasted locational marginal prices using LSTM networks and detected demand anomalies using K-means clustering. Implemented structured streaming for real-time data ingestion and processing.
Tools & Technologies: PySpark, Time Series, LSTM, Structured Streaming, K-means
GitHub: View Repo
NYC Taxi Trip Analysis

Analyzed large-scale NYC taxi trip data to identify demand hotspots, predict trip durations, and estimate fares using classification models. Applied DBSCAN and K-means clustering for spatial demand analysis and visualized ride patterns with heatmaps.
Tools & Technologies: PySpark, MLlib, Logistic Regression, DBSCAN, K-means
GitHub: View Repo
Graph Analytics on SEC Filings

Processed SEC filings using Neo4j and PySpark to map executive-level connections across publicly traded companies. Applied graph centrality metrics—including betweenness, degree, and PageRank—to uncover patterns of financial influence and corporate governance networks.
Tools & Technologies: Neo4j, PySpark, Graph Analytics, Financial Modeling
GitHub: View Repo
Mortgage Analysis – Fannie Mae Loan Performance

Analyzed 60GB+ of Fannie Mae mortgage performance data from 2010–2011 to assess credit trends, FICO score distributions, and loan delinquency rates. Generated quarterly performance insights and risk metrics to support financial analysis and reporting.
Tools & Technologies: PySpark SQL, Financial Analysis, Data Visualization
GitHub: View Repo
Social Network Analysis for Food Security
Applied social network analysis techniques to model relationships and information flows within food security systems. Explored how network structures—such as centrality, clustering, and bridging roles—affect the resilience and efficiency of food distribution and policy coordination networks.
Tools & Technologies: Python, Network Analysis, Graph Metrics, Data Visualization
GitHub: View Repo